
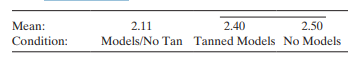
Do the media influence your attitude toward tanning? Refer to the Basic and Applied Social Psychology (May 2010) study of whether product advertisements influence consumers’ attitudes toward tanning, Exercise 9.29 (p. 545). Recall that college students were randomly assigned to one of three conditions—view product advertisements featuring models with a tan, view product advertisements featuring models without a tan, or view products advertised with no models. An ANOVA F-test revealed that the mean attitude toward tanning differed across the conditions. The researchers followed up this analysis with a multiple comparisons of means using an experimentwise error rate of .05. These results are summarized below. Fully interpret the results. Does it appear that the type of product advertisement can influence a consumer’s attitude toward tanning?
Exercise 9.29
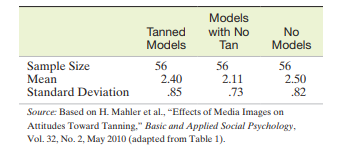
Do the media influence your attitude toward tanning? Dermatologists’ primary recommendation to prevent skin cancer is minimal exposure to the sun. Yet, models used in product advertisements are typically well tanned. Do such advertisements influence a consumer’s attitude toward tanning? University of California and California State University researchers designed an experiment to investigate this phenomenon and published their results in Basic and Applied Social Psychology (May 2010). College student participants were randomly assigned to one of three conditions: (1) view product advertisements featuring models with a tan, (2) view product advertisements featuring models without a tan, or (3) view products advertised with no models (control group). The objective was to determine whether the mean attitude toward tanning differs across the three conditions. A tanning attitude index (measured on a scale of 0 to 5 points) was recorded for each participant. The results are summarized in the accompanying table.
a. Identify the type of experimental design utilized by the researchers.
b. Identify the experimental units, dependent variable, and treatments for the design.
c. Set up the null hypothesis for a test to compare the treatment means.
d. The sample means shown in the table are obviously different. Explain why the researchers should not use these means alone to test the hypothesis, part c.
e. The researchers conducted an ANOVA on the data and reported the following results: F = 3.60, p![]() value = .03. Carry out the test, part c. Use
value = .03. Carry out the test, part c. Use ![]() Â = .05 to draw your conclusion.
 = .05 to draw your conclusion.
f. What assumptions are required for the inferences derived from the test to be valid?
"Looking for a Similar Assignment? Get Expert Help at an Amazing Discount!"

