
Cable TV subscriptions and “cord cutters.†Refer to the Pew Research Center Survey (December 2015) of current and former cable/satellite TV customers, Exercise 2.4 (p. 72). In a representative sample of 2,001 adults living in the United States, 1,521 reported that they currently receive cable or satellite TV service at home; 180 revealed that they have never subscribed to cable/satellite TV service at home; and the remainder (300 adults) admitted that they are “cord cutters,†i.e., they canceled the cable/ satellite TV service. Suppose a major cable TV provider claims that in the population of all U.S. adults, 75% currently subscribe to cable/satellite TV service, 10% never have subscribed, and 15% are “cord cutters.â€
a. If the true percentages of U.S. adults in each subscriber status group are as claimed by the cable TV provider, how many of the sampled adults would you expect to find in each subscriber category?
b. Give the null hypothesis for testing the cable TV provider’s claim.
c. Find the chi-square test statistic for testing the null hypothesis, part b.
d. Find the rejection region for the test if a = .05.
e. Find the p-value of the test.
f. Give the appropriate conclusion for the test in the words of the problem.
Exercise 2.4
Cable TV subscriptions and “cord cutters.†Has the increasing popularity of smartphones and video streaming over the Internet affected cable and satellite TV subscriptions? This was one of the questions of interest in a recent Pew Research Center survey (December 2015). Telephone (both landline and cell phone) interviews were conducted on a representative sample of 2,001 adults living in the United States. For this sample, 1,521 adults reported that they currently receive cable or satellite TV service at home, 180 revealed that they have never subscribed to cable/satellite TV service at home, and the remainder (300 adults) admitted that they are “cord cutters,†i.e., they canceled the cable/satellite TV service. The results are summarized in the Minitab pie chart shown.
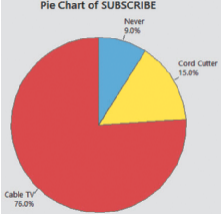
a. According to the pie chart, what proportion of the adults in the sample currently have a cable/satellite TV subscription at home? Verify the accuracy of this proportion using the survey results.
b. Now consider only the 1,821 adults in the sample that have at one time or another subscribed to cable/satellite TV service. Create a graph that compares the proportions of adults who currently subscribe to cable/satellite TV service with the proportion who are “cord cutters.â€
"Looking for a Similar Assignment? Get Expert Help at an Amazing Discount!"

